


Three charts that show what changed India's GDP in Q1 FY18


Central Statistics Office (CSO), Ministry of Statistics and Programme Implementation on Thursday released the GDP data for Q1 FY18. The growth of the gross domestic product (GDP) slowed in the first quarter of the current financial year to 5.7%. India's GDP stood at 6.1% for January - March 2017 (Q4FY17) and 7.9% of April - June 2017 (Q1FY17).
At constant prices
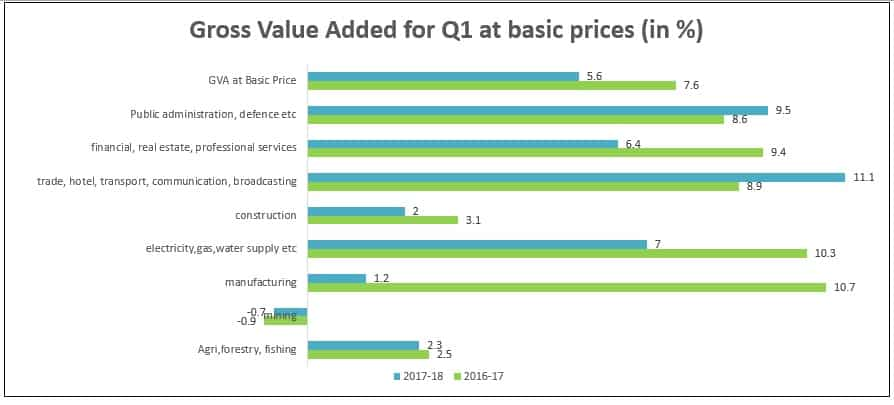
GDP at constant (2011-12) prices in Q1 of 2017-18 is estimated at Rs 31.10 lakh crore, as against Rs 29.42 lakh crore in Q1 of 2016-17, showing a growth rate of 5.7 percent. Quarterly GVA at basic price at constant (2011-2012) prices for Q1 of 2017-18 is estimated at ` 29.04 lakh crore, as against `27.51 lakh crore in Q1 of 2016-17, showing a growth rate of 5.6 percent over the corresponding quarter of previous year.
The economic activities which registered growth of over 7 percent in Q1 of 2017-18 over Q1 of 2016-17 are ‘trade, hotels, transport & communication and services related to broadcasting’, ‘public administration, defence and other services’ and ‘electricity, gas, water supply & other utility services’. The growth in the ‘agriculture, forestry and fishing’, ‘mining and quarrying’, ‘manufacturing’, ‘construction’ and financial, insurance, real estate and professional services is estimated to be 2.3 per cent, (-) 0.7 percent, 1.2 per cent, 2.0 percent and 6.4 percent respectively during this period.
At current prices
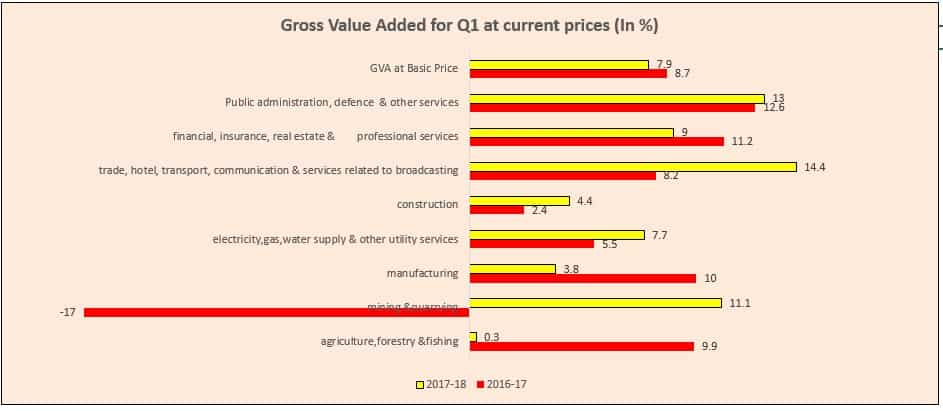
GDP is derived by adding taxes on products net of subsidies on products to GVA at basic prices. GDP at current prices in Q1 of 2017-18 is estimated at `38.84 lakh crore, as against `35.55 lakh crore in Q1 of 2016-17, showing a growth rate of 9.3 percent. GVA at Basic Price at current prices in Q1 of 2017-18, is estimated at `35.77 lakh crore, as against `33.17 lakh crore in Q1, 2016-17, showing an increase of 7.9 percent. Growth in collection of Union excise duties, customs duties and service tax was 7.3 percent, 15.0 percent and 20.4 percent respectively in Q1 of 2017-18 as against 60.5 percent, 17.8 percent and 28.5 percent respectively in Q1 of 2016-17.
Estimates of Expenditure of GDP
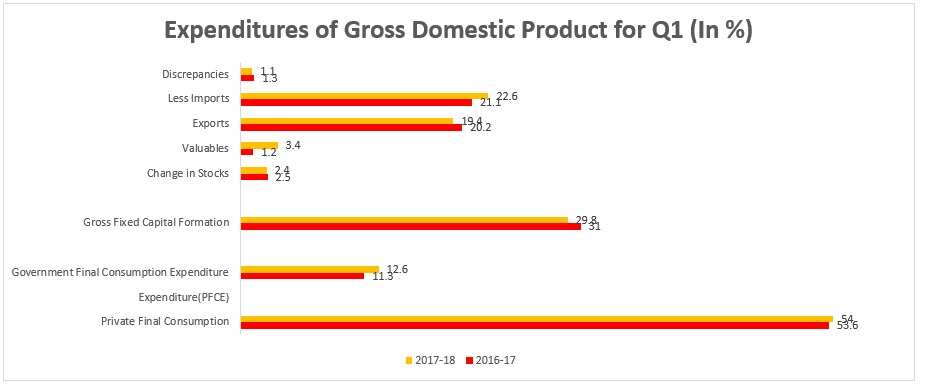
The components of expenditure on Gross Domestic Product, namely, consumption expenditure and capital formation, are normally measured at market prices. The aggregates presented in the following paragraphs, therefore, are in terms of market prices.
06:40 PM IST
 Canada to unveil budget as experts doubt fiscal targets
 Fitch cuts China's ratings outlook on growth risks
 India needs 1 million fast chargers to become 100% electric in 2 and 3 wheelers by 2030: Former NITI Aayog CEO Amitabh Kant
 States to sustain capex focus with improved fiscal space: Ind-Ra report
 gains: Report") India pips countries like Germany, Britain in GDP (PPP) gains: Report
India pips countries like Germany, Britain in GDP (PPP) gains: Report